Skip to content
Cold Email KPIs: 12 Metrics That Actually Measure Success
Quick Answer
The most important cold email KPIs are inbox placement, delivery rate, bounce rate, spam complaint rate, reply rate, positive reply rate,
meetings booked, meeting attendance, opportunities created, and revenue generated.
A healthy campaign does not simply produce opens. It successfully moves prospects through four measurable stages:
Inbox placement → Prospect engagement → Sales conversations → Revenue
In 2026, reply rate generally provides a more useful engagement signal than open rate.
Instantly reports an overall cold email reply rate of 3.43%, while Hunter reports a 4.5% average sequence reply rate in its State of Email Outreach research.
However, neither number should be treated as the final measure of success.
A campaign producing qualified meetings and profitable customers can outperform one with a higher reply rate but weaker lead quality.
The right cold email metrics help you identify exactly where a campaign is failing and what to improve next.
Table of Contents
- The four levels of cold email measurement
- Cold email KPI comparison table
- How to calculate each KPI
- Why open rate is no longer enough
- A step-by-step measurement process
- KPI advantages and limitations
- Practical cold email campaign example
- Real screenshot placements
- Frequently asked questions
- Conclusion and next steps
The Four Levels of Cold Email Measurement
Instead of placing every metric in one dashboard, LeadCanal recommends organizing cold email KPIs into four levels.
Level 1: Deliverability Metrics
These metrics show whether your emails were technically accepted and whether they had a realistic opportunity to reach the primary inbox.
The main deliverability metrics include:
- Delivery rate
- Bounce rate
- Inbox placement rate
- Spam complaint rate
- Missing or rejected email rate
Deliverability creates the performance ceiling for the entire campaign.
An excellent offer cannot generate replies when a significant percentage of messages are rejected, filtered, or placed in spam.
Level 2: Engagement Metrics
Engagement metrics show whether the audience finds the message relevant enough to respond or take another action.
These include:
- Open rate
- Reply rate
- Positive reply rate
- Click-through rate
- Unsubscribe rate
Open and click data can provide directional information, but replies offer stronger evidence of genuine human engagement.
Level 3: Pipeline Metrics
Pipeline metrics connect email activity with sales outcomes.
These include:
- Meetings booked
- Meeting-booked rate
- Meeting attendance rate
- Qualified opportunities created
- Cost per meeting
A campaign with fewer replies but more qualified meetings may be more valuable than a campaign that generates many low-intent responses.
Level 4: Revenue Metrics
Revenue metrics determine whether the campaign is commercially successful.
The most important are:
- Customers acquired
- Customer acquisition cost
- Pipeline value
- Closed revenue
- Return on investment
This level should guide major decisions about campaign scaling, budget allocation, targeting, and offers.
Cold Email KPI Comparison Table
| Cold email KPI | Formula | What it measures | Recommended use |
|---|---|---|---|
| Delivery rate | Delivered ÷ Sent × 100 | Successful technical delivery | Monitor list and sending health |
| Bounce rate | Bounced ÷ Sent × 100 | Invalid or rejected emails | Diagnose data-quality problems |
| Inbox placement | Inbox emails ÷ Tested emails × 100 | Inbox versus spam placement | Evaluate sender reputation |
| Spam complaint rate | Spam complaints ÷ Delivered × 100 | Recipient dissatisfaction | Protect domain reputation |
| Open rate | Unique opens ÷ Delivered × 100 | Tracked email opens | Use as a secondary signal |
| Reply rate | Replies ÷ Delivered × 100 | Total responses received | Measure general engagement |
| Positive reply rate | Interested replies ÷ Delivered × 100 | Genuine prospect interest | Primary campaign-quality KPI |
| Meeting-booked rate | Meetings booked ÷ Delivered × 100 | Email-to-meeting conversion | Measure pipeline creation |
| Meeting attendance | Meetings attended ÷ Meetings booked × 100 | Meeting quality and commitment | Evaluate qualification |
| Opportunity rate | Opportunities ÷ Delivered × 100 | Sales-qualified outcomes | Connect outreach with pipeline |
| Customer conversion | Customers ÷ Delivered × 100 | Closed customer acquisition | Measure final campaign output |
| Campaign ROI | Net return ÷ Campaign cost × 100 | Financial performance | Make scaling decisions |
Different platforms may calculate these metrics using emails sent, delivered emails, or unique prospects.
Use one calculation method consistently when comparing campaigns.
The 12 Cold Email Metrics You Should Track
1. Delivery Rate
Delivery rate shows the percentage of messages accepted by receiving email systems.
Formula:
Delivery Rate = Delivered Emails ÷ Emails Sent × 100
A high delivery rate is necessary, but it does not prove that messages reached the primary inbox.
An email can be accepted and still be routed to spam.
2. Bounce Rate
Bounce rate measures the percentage of emails that could not be delivered.
Formula:
Bounce Rate = Bounced Emails ÷ Emails Sent × 100
Hard bounces generally indicate invalid or non-existent addresses.
Soft bounces may result from temporary problems such as full inboxes or receiving-server issues.
Hunter’s State of Email Outreach reports an average bounce rate of 3.6%.
That is a market observation rather than an ideal target; senders should work to keep their own bounce rates lower through email verification and careful list management.
3. Inbox Placement Rate
Inbox placement measures how often accepted messages reach the primary inbox instead of spam or promotional folders.
It should be evaluated using seed-list testing or a specialized inbox-placement tool.
Regular testing can reveal reputation issues that delivery-rate reporting alone cannot show.
4. Spam Complaint Rate
Spam complaint rate shows how frequently recipients mark your email as spam.
Google advises senders to keep the spam rate reported in Postmaster Tools below 0.1% and avoid reaching 0.3% or higher.
High complaint levels can increase spam classification and damage future campaign performance.
5. Open Rate
Open rate estimates the percentage of delivered emails opened by recipients.
Formula:
Open Rate = Unique Tracked Opens ÷ Delivered Emails × 100
Open rate was traditionally used to evaluate subject lines and sender recognition.
It is now less dependable because privacy systems can hide or distort open activity.
Apple’s Mail Privacy Protection can prevent senders from determining whether a recipient opened an email.
As a result, open rate should be treated as a diagnostic signal not a primary success KPI.
6. Reply Rate
Reply rate calculates the percentage of delivered emails that receive any response.
Formula:
Reply Rate = Total Replies ÷ Delivered Emails × 100
Instantly reports a 3.43% overall average reply rate, with elite campaigns exceeding 10%.
It also reports that 58% of replies come from the first campaign step and 42% from follow-ups.
Total replies can include positive responses, objections, referrals, out-of-office messages, and unsubscribe requests.
Therefore, reply rate must be evaluated alongside positive reply rate.
7. Positive Reply Rate
Positive reply rate measures responses showing genuine business interest.
Examples include:
- Requests for additional information
- Relevant referrals
- Pricing questions
- Meeting requests
- Interest in a future conversation
Formula:
Positive Reply Rate = Positive Replies ÷ Delivered Emails × 100
Hunter identifies reply rate particularly positive reply rate as a crucial cold email success metric.
8. Click-Through Rate
Click-through rate measures how many recipients clicked a tracked link.
It can be useful when the email directs prospects to a case study, calculator, report, or booking page.
However, excessive link tracking can introduce deliverability concerns, and clicks do not automatically indicate purchase intent.
For conversation-focused campaigns, replies may be more valuable than clicks.
9. Meeting-Booked Rate
This metric shows how effectively delivered emails create scheduled sales conversations.
Formula:
Meeting-Booked Rate = Meetings Booked ÷ Delivered Emails × 100
Track meetings against unique contacted prospects rather than total sequence steps when possible.
Otherwise, sending multiple follow-ups to one prospect can distort the calculation.
10. Meeting Attendance Rate
A booked meeting has limited value when the prospect does not attend.
Formula:
Meeting Attendance Rate = Meetings Attended ÷ Meetings Booked × 100
A low attendance rate can indicate weak qualification, unclear expectations, excessive booking friction, or poor reminder processes.
11. Opportunity Creation Rate
Opportunity rate measures how many contacted prospects become qualified sales opportunities.
Formula:
Opportunity Rate = Qualified Opportunities ÷ Delivered Emails × 100
This metric reveals whether the targeting and offer are attracting companies with real need, budget, authority, and timing.
12. Revenue and ROI
Revenue is the strongest confirmation that a cold email campaign is producing business value.
Formula:
Campaign ROI = (Revenue Attributed to Campaign − Campaign Cost) ÷ Campaign Cost × 100
Campaign costs may include:
- Contact data
- Email infrastructure
- Sending software
- Copywriting
- Research and personalization
- Team or agency costs
Revenue reporting may take longer than reply reporting, especially when the sales cycle lasts several months.
Continue tracking prospects through the CRM after the email campaign ends.
Why Open Rate Alone Can Be Misleading
A 70% open rate may appear impressive, but it does not prove that 70% of recipients consciously read the email.
Privacy proxies, security scanners, and automated systems may trigger tracking pixels.
Apollo current measurement guidance recommends prioritizing deliverability, positive replies, meetings, and closed revenue rather than relying on raw open rate.
Open rate remains useful when interpreted carefully.
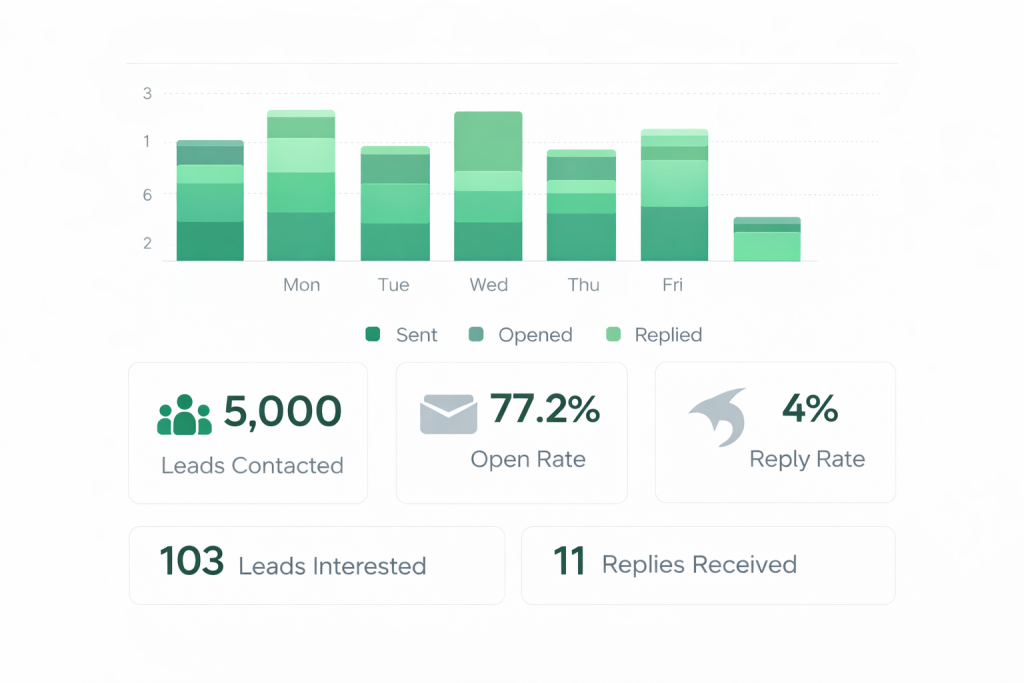
For example:
- Low delivery and low opens: likely data or deliverability problem
- High delivery but low opens: possible inbox-placement, sender-name, or subject-line issue
- High opens but low replies: likely targeting, offer, relevance, or copy problem
- Strong replies but few meetings: likely CTA or qualification problem
- Many meetings but little revenue: likely offer, sales process, or customer-fit problem
This diagnostic sequence is more useful than comparing a single open-rate number with a generic benchmark.
Step-by-Step Cold Email KPI Process
Step 1: Establish Consistent Definitions
Decide whether each rate will be calculated against sent emails, delivered emails, or unique prospects. Document the method.
Step 2: Confirm Technical Health
Check SPF, DKIM, DMARC, bounce rate, spam complaints, sender reputation, and inbox placement before evaluating copy.
Step 3: Track Engagement Quality
Separate automatic, negative, neutral, referral, and positive responses. Do not report every reply as qualified interest.
Step 4: Connect Meetings to Campaigns
Use campaign names, tracking fields, or CRM source data to identify which audience, offer, and sequence generated each meeting.
Step 5: Measure Sales Progress
Track attended meetings, qualified opportunities, proposals, customers, and closed revenue.
Step 6: Segment the Results
Compare performance by:
- Industry
- Company size
- Decision-maker role
- Geographic market
- Trigger event
- Offer
- Email version
Smaller, tightly targeted campaigns often outperform broad batches.
Woodpecker cites benchmark data showing a 5.8% reply rate for campaigns under 50 recipients compared with 2.1% for campaigns containing 500 or more recipients.
Step 7: Change One Variable
Test one major element at a time, such as the list, offer, opening line, proof point, CTA, or follow-up structure.
Step 8: Review Revenue Before Scaling
Do not scale a campaign based only on open or reply rate. Confirm that it creates qualified pipeline at an acceptable acquisition cost.
Pros and Cons of Tracking Cold Email KPIs
Advantages
- Identifies the exact stage causing performance loss
- Separates deliverability issues from copy problems
- Improves campaign testing and decision-making
- Connects outreach activity with pipeline
- Makes agency or team performance more transparent
- Supports evidence-based scaling decisions
Limitations
- Platforms may calculate the same metric differently
- Open tracking can be distorted
- Attribution becomes difficult across multiple channels
- Small samples can create misleading percentages
- Long sales cycles delay revenue reporting
- High engagement does not guarantee customer quality
KPIs become valuable when evaluated together. One metric rarely explains the full campaign.
Practical Cold Email KPI Example
Consider a hypothetical LeadCanal campaign with the following results:
- Emails sent: 1,000
- Emails delivered: 970
- Bounces: 30
- Total replies: 58
- Positive replies: 24
- Meetings booked: 12
- Meetings attended: 9
- Qualified opportunities: 4
- Customers acquired: 2
- Delivery rate: 970 ÷ 1,000 × 100 = 97%
- Bounce rate: 30 ÷ 1,000 × 100 = 3%
- Reply rate: 58 ÷ 970 × 100 = 5.98%
- Positive reply rate: 24 ÷ 970 × 100 = 2.47%
- Meeting-booked rate: 12 ÷ 970 × 100 = 1.24%
- Attendance rate: 9 ÷ 12 × 100 = 75%
- Opportunity rate: 4 ÷ 970 × 100 = 0.41%
- Customer conversion rate: 2 ÷ 970 × 100 = 0.21%
The 5.98% reply rate is encouraging, but the campaign should ultimately be judged by the value of the two customers compared with the total campaign cost.
This is a hypothetical calculation, not a claim about an actual LeadCanal client campaign.
Real Screenshot Placements
Screenshot 1: Campaign Performance Dashboard
Insert an anonymized LeadCanal campaign screenshot showing:
- Sent
- Delivered
- Bounced
- Replies
- Positive replies
LeadCanal campaign reporting separates technical delivery from meaningful prospect engagement.
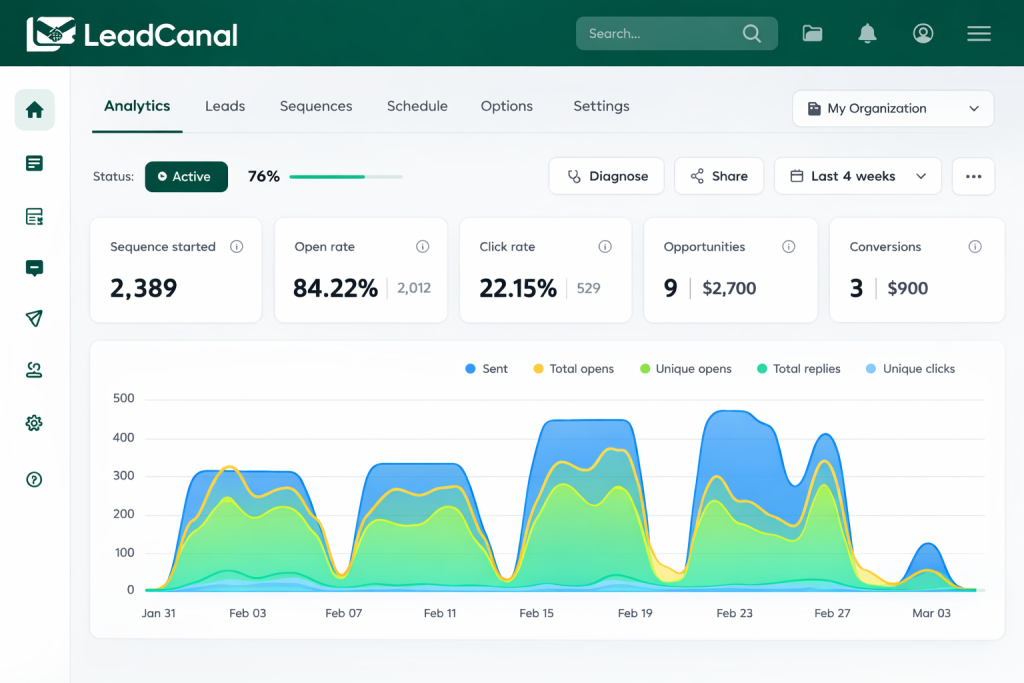
Cold email KPI dashboard showing delivery, bounce, reply and positive reply metrics.
Screenshot 2: Reply Classification
Insert a real screenshot showing replies classified as:
- Positive
- Negative
- Referral
- Out of office
- Unsubscribe
Reply classification prevents automatic and negative responses from inflating campaign performance.
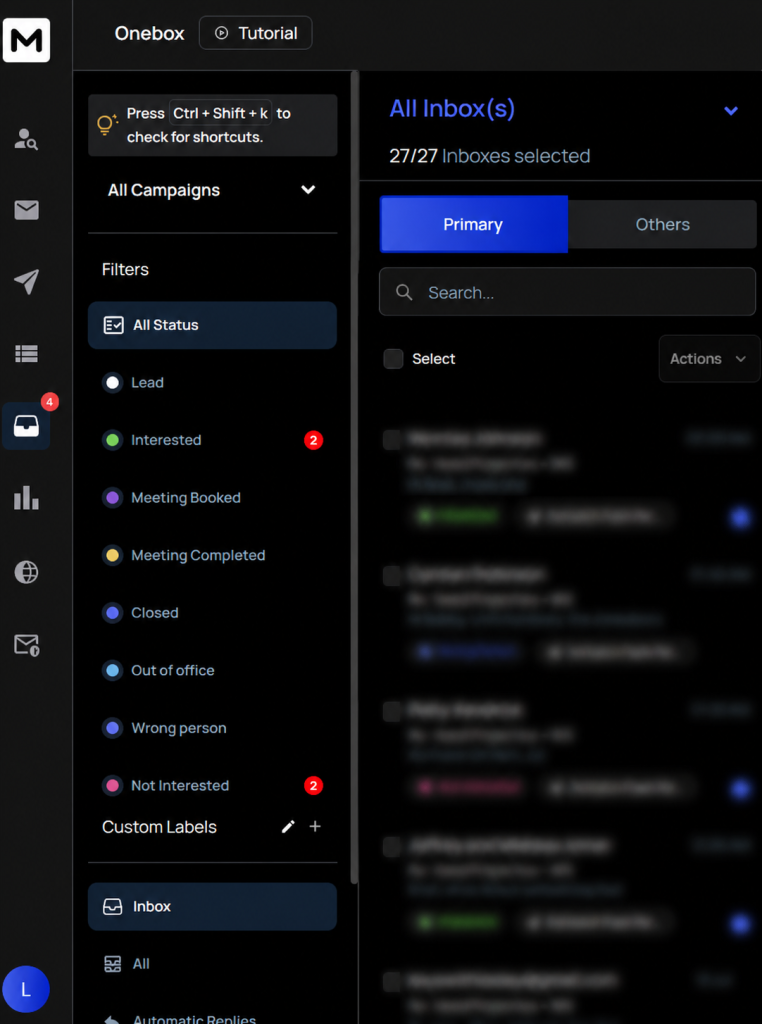
Cold email responses organized by positive, negative and automatic reply categories.
Frequently Asked Questions
What are the most important cold email KPIs?
The most important KPIs are inbox placement, bounce rate, spam complaint rate, reply rate, positive reply rate, meetings booked,
opportunities created, customers acquired, and ROI.
What is a good cold email reply rate?
Current large-platform reports place average reply rates at approximately 3.43% to 4.5%. Results above 5% can indicate strong performance,
but audience quality and positive replies matter more than the total percentage.
Is open rate still an important metric?
It is a secondary diagnostic metric. Privacy features and automated systems can make open data unreliable,
so positive replies and sales outcomes should carry more weight.
How is positive reply rate calculated?
Divide interested or qualified replies by delivered emails and multiply by 100.
Should replies be calculated from sent or delivered emails?
Delivered emails provide a clearer engagement calculation because bounced messages had no chance to receive a reply. Use the same method consistently.
What bounce rate should cold email campaigns target?
The goal should be to keep it as low as possible. High bounce rates indicate weak contact data and may damage sender reputation.
Email verification should happen before every campaign.
How often should cold email KPIs be reviewed?
Technical metrics should be checked during campaign operation.
Engagement can be reviewed after sufficient data is available, while pipeline and revenue must continue to be tracked throughout the sales cycle.
Which cold email metric matters most?
Positive reply rate is one of the best early indicators, while qualified pipeline, customers acquired, and ROI are the strongest final measures.
Conclusion
Cold email KPIs should explain the complete journey from inbox placement to revenue.
Delivery, bounce, and spam metrics protect the campaign’s technical foundation. Reply and positive reply rates measure message relevance.
Meetings and opportunities measure sales impact. Customer acquisition and ROI determine whether the campaign deserves further investment.
The objective is not to produce the highest possible open rate.
It is to create qualified sales conversations predictably and convert them into profitable business relationships.
Build a Cold Email System You Can Measure
LeadCanal helps B2B companies develop targeted cold email campaigns built around accurate data, strong deliverability, relevant messaging, and measurable pipeline outcomes.
Request a cold email performance audit from LeadCanal to identify where your current outreach is losing prospects and which KPI should be improved first.