Skip to content

Cold Email Reply Rate Benchmarks for 2026
Quick Answer
The average B2B cold email reply rate in 2026 is approximately 3% to 5%. A campaign reaching 5% to 8% is performing strongly,
while 10% or more is generally considered elite. A reply rate below 2% often indicates a problem with deliverability, targeting, contact data, message relevance, or the offer.
Instantly reports a platform-wide average reply rate of 3.43%, Saleshandy reports 3.7%, and Apollo places a well-run campaign in the 3% to 5% range. 6717view
However, total replies should not be the only measure of success. Positive replies, meetings booked,
qualified opportunities, and revenue provide a more accurate picture of campaign performance.
Table of Contents
- What is a cold email reply rate?
- Cold email reply rate benchmarks for 2026
- Why benchmark reports differ
- Factors that influence reply rates
- Step-by-step improvement process
- Generic vs optimized campaigns
- Pros and cons of benchmarks
- Practical campaign example
- Real screenshot recommendations
- Frequently asked questions
- Conclusion
What Is a Cold Email Reply Rate?
Cold email reply rate measures the percentage of outbound emails that receive a response.
Reply Rate = Total Replies ÷ Total Delivered Emails × 100
For example, if 1,000 emails are delivered and 40 recipients reply, the reply rate is 4%.
The calculation must remain consistent. Some platforms divide replies by total emails sent, while others use delivered emails, unique prospects, or first-touch sends.
Instantly, for example, defines overall reply rate as total replies divided by total emails sent.
lso include interested responses, negative replies, out-of-office messages, and unsubscribe requests.
For more useful reporting, LeadCanal recommends tracking:
- Total reply rate
- Positive reply rate
- Meeting-booked rate
- Qualified opportunity rate
- Revenue generated
This prevents a campaign with many negative or automatic responses from appearing successful.
Cold Email Reply Rate Benchmarks for 2026
| Performance level | Reply rate | What it may indicate |
|---|---|---|
| Critical | Below 1% | Major deliverability, targeting, data, or offer issue |
| Below average | 1%–2% | Weak relevance, broad targeting, or poor list quality |
| Average | 3%–5% | A reasonably structured and targeted campaign |
| Strong | 5%–8% | Good segmentation, copy, deliverability, and follow-up |
| Elite | 10%+ | Precise ICP, compelling offer, and high relevance |
Instantly’s 2026 benchmark lists a 3.43% average reply rate, a 5.5% top-quartile rate, and more than 10% for elite senders.
Apollo classifies 3% to 5% as average, 5% to 8% as strong, and 10% or more as excellent.
analysis of 53.1 million cold emails found a 3.7% average and reported that campaigns consistently generating more than 7% were outperforming the broader market.
are reference points rather than guarantees.
Results can vary based on the industry, seniority of the decision-maker, deal value, market awareness, targeting, and strength of the offer.
A campaign with a 2% reply rate may still be profitable when one closed contract has a high value.
A campaign with a 10% reply rate may still fail when most responses are negative or unqualified.
Why Do Benchmark Reports Differ?
Cold email studies use different datasets, campaign types, audiences, and definitions.
One platform may count every response, while another may count only unique prospect replies or positive replies.
Some reports represent self-service software users, while others analyze campaigns managed by professional agencies.
Compare your results using the same:
- Reply-rate formula
- Target audience
- Geographic market
- Campaign type
- Reporting period
- Definition of a positive reply
Your own historical performance by segment will eventually become more useful than a platform-wide average.
Open rates also require caution. Privacy tools and email security systems can automatically load tracking pixels, creating false or inflated opens.
Apollo and Saleshandy therefore recommend giving greater importance to positive replies, meetings, pipeline, and revenue.That Influence Cold Email Reply Rates
1. Targeting and List Size
Smaller, focused campaigns generally perform better than broad email blasts.
Saleshandy reports that campaigns containing fewer than 200 prospects generated nearly twice as many replies and substantially more positive replies than campaigns targeting more than 1,000 prospects. ects according to:
- Industry
- Company size
- Job title
- Business problem
- Buying trigger
- Relevant use case
A founder, CFO, and Head of Sales should not receive the same message because their priorities and responsibilities are different.
2. Personalization Depth
Adding a first name is basic customization, not meaningful personalization.
Strong personalization connects a visible business signal to a relevant challenge.
Useful signals may include a hiring campaign, product launch, funding announcement, expansion into a new market, leadership change, or public company update.
The objective is to explain why the conversation is relevant now.
Avoid inserting personal information that has no connection to the business problem being discussed.
3. Deliverability
An email cannot earn a reply if it does not reach the inbox.
Before increasing sending volume, configure SPF, DKIM, and DMARC, verify email addresses, maintain consistent sending activity, and monitor bounce and spam-complaint rates.
Saleshandy recommends keeping bounce rates below 2%. Its data showed a 1.53% bounce rate for verified lists compared with 2.55% for unverified lists.
senders to keep user-reported spam rates below 0.1% and prevent them from reaching 0.3% or higher when sending bulk email to personal Gmail accounts. -Up Sequence
Instantly reports that 58% of cold email replies come from the first campaign step, while the remaining 42% come from follow-ups.
aign after one email can therefore leave many potential conversations untouched.
A practical sequence may contain four to six total touches spread across approximately three weeks.
Each follow-up should introduce something useful, such as:
- A new observation
- Relevant proof
- A different use case
- A short case example
- An alternative CTA
Repeating “just following up” does not give the recipient a new reason to respond.
5. Message and Offer Quality
A strong first email normally contains:
- One relevant business problem
- One clear desired outcome
- One credibility point
- One low-friction CTA
Keep the email short and easy to scan. A simple question such as “Worth exploring?” may create less resistance than immediately requesting a 30-minute sales presentation.
The offer must also match the prospect’s current priorities. Better writing cannot rescue an irrelevant offer.
Step-by-Step Process to Improve Your Reply Rate
Step 1: Check Inbox Placement
Review authentication, domain health, bounces, complaints, blocklists, and sending consistency before changing the copy.
Step 2: Define One Narrow ICP
Choose one industry, company-size range, role, business problem, and buying situation.
Step 3: Verify Every Contact
Remove invalid, duplicate, risky, catch-all, and irrelevant addresses before launching the campaign.
Step 4: Create a Segment-Specific Offer
Connect one measurable business problem with a realistic and credible outcome.
Step 5: Write a Short First Email
Use a relevant opening, concise value proposition, proof point, and one clear CTA.
Step 6: Build Value-Based Follow-Ups
Add new information in every step rather than sending repeated reminders.
Step 7: Measure Positive Outcomes
Track positive replies, meetings, opportunities, and revenue instead of optimizing only for opens.
Step 8: Test One Variable at a Time
Test the audience, offer, subject line, opening sentence, proof point, or CTA separately
Changing everything simultaneously makes it difficult to identify what produced the improvement.
Step 9: Follow Applicable Laws
Use accurate sender information, honest subject lines, a clear identity, and an accessible opt-out process.
Businesses targeting the United States should review CAN-SPAM requirements, while UK outreach may also fall under PECR and data-protection rules. Optimized Cold Email Campaign
| Area | Generic campaign | Optimized campaign |
|---|---|---|
| Prospect list | Large and broad | Small and micro-segmented |
| Personalization | Name and company fields | Signal- and pain-based relevance |
| Opening | Generic introduction | Relevant prospect observation |
| Email focus | Sender’s product | Prospect’s business problem |
| CTA | High-commitment meeting request | Low-friction question |
| Follow-ups | Repeated reminders | New value in every touch |
| Main KPI | Open rate | Positive replies and meetings |
| Likely reply range | Often 1%–3% | Commonly 5%–10%+ with strong execution |
Pros and Cons of Reply-Rate Benchmarks
Pros
- Provide a quick campaign-health reference
- Help identify targeting or deliverability problems
- Support realistic goals for sales teams
- Make testing results easier to compare
- Help clients understand campaign performance
Cons
- Different platforms calculate the metric differently
- Total replies may include negative and automatic responses
- Averages hide differences between industries and offers
- A high reply rate does not guarantee qualified opportunities
- Benchmarks cannot replace revenue and pipeline reporting
Use benchmarks to diagnose performance, not to guarantee outcomes.
Practical Campaign Example
Imagine a LeadCanal campaign that delivers 500 cold emails to a carefully selected B2B segment.
At the 3.43% platform benchmark, it would generate approximately 17 replies.
At a strong 6% reply rate, it would generate 30 replies.
and elite 10% reply rate, it would generate 50 replies.
Now suppose the campaign receives 30 replies, but only 12 recipients show genuine interest.
- Total reply rate: 30 ÷ 500 × 100 = 6%
- Positive reply rate: 12 ÷ 500 × 100 = 2.4%
If six meetings are booked:
- Meeting-booked rate: 6 ÷ 500 × 100 = 1.2%
This example shows why LeadCanal evaluates the entire funnel.
Reply volume matters, but reply quality, qualification, meeting attendance, sales opportunities, and closed revenue matter more.
Real Screenshot Recommendations
Screenshot 1: Campaign Overview
Insert an anonymized LeadCanal campaign dashboard showing:
- Delivered emails
- Total replies
- Positive replies
- Meetings booked
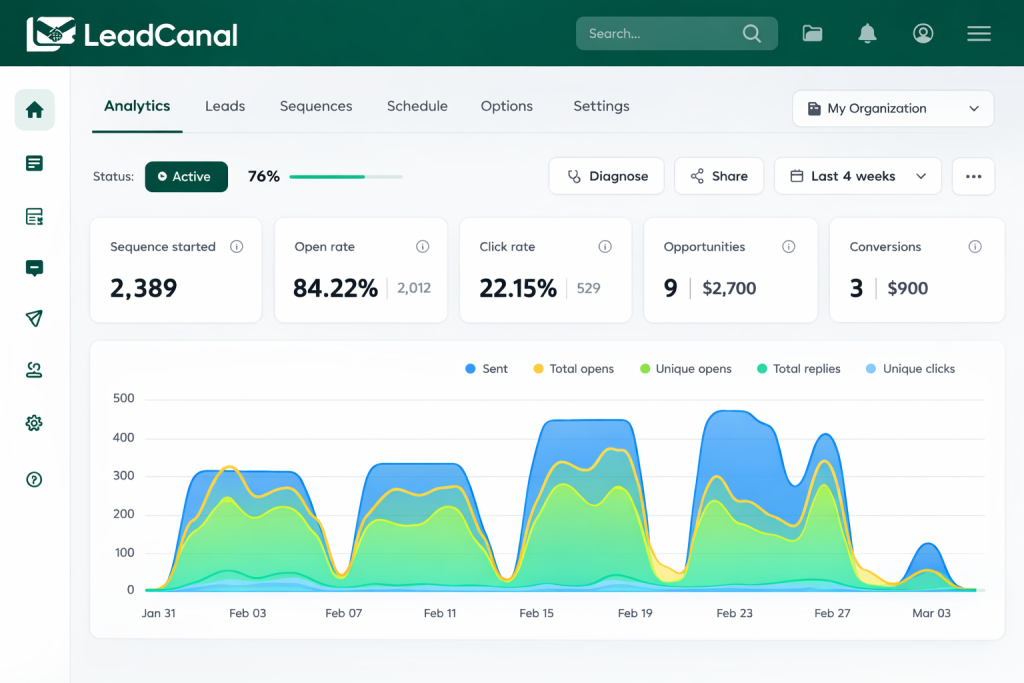
A real cold email campaign should be evaluated beyond open rates.
Screenshot 2: Reply Classification
Insert a real screen showing reply categories such as:
- Interested
- Not interested
- Out of office
- Referral
- Unsubscribe
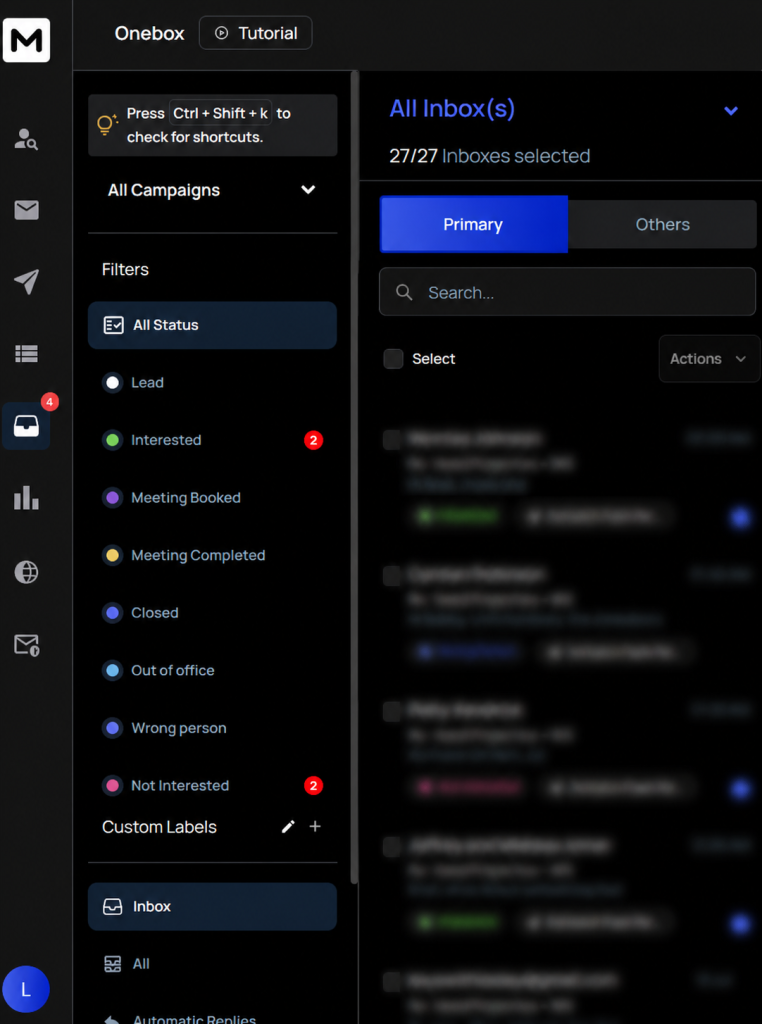
Total replies and positive replies represent different performance metrics.
Screenshot 3: Deliverability Health
Insert a Google Postmaster Tools or deliverability-platform screenshot. Hide all client names, email addresses, and domain information.

Inbox health creates the performance ceiling for every cold email campaign.
Use real, anonymized screenshots instead of stock dashboards or invented campaign results. This provides original evidence and strengthens the credibility of the article.
Frequently Asked Questions
1. What is a good cold email reply rate in 2026?
A reply rate of 3% to 5% is average, 5% to 8% is strong, and 10% or more is excellent.
2. Is a 1% cold email reply rate bad?
It is usually below average. Review inbox placement, contact quality, targeting, message relevance, offer strength, and follow-ups.
3. How is cold email reply rate calculated?
Divide the number of replies by the number of delivered emails and multiply the result by 100.
4. What is a positive reply rate?
It is the percentage of delivered emails that generate genuine interest, such as a request for more information, referral, pricing discussion, or meeting.
5. How many follow-ups should I send?
A practical sequence normally contains four to six total emails. Every follow-up should add new information or value.
6. Does personalization improve reply rates?
Yes, when it uses genuine business context. A relevant trigger or pain point is more valuable than simply adding a name or company field.
7. What bounce rate is acceptable?
Aim to keep the bounce rate below 2%. Higher rates may indicate poor contact data and can negatively affect sender reputation.
8. Are cold email open rates reliable?
Open rates are useful as a directional signal, but privacy tools and automated security scans can inflate them. Positive replies and booked meetings are stronger performance metrics.
Conclusion
The most useful cold email reply rate benchmark for 2026 is 3% to 5%. A rate of 5% to 8% represents strong performance, while 10% or more generally indicates elite execution.
High-performing cold email campaigns combine accurate contact data, narrow targeting, reliable inbox placement, relevant messaging, thoughtful follow-ups, and a strong offer.
Most importantly, successful B2B teams measure positive replies, meetings, opportunities, and revenue not only opens or total responses.
Turn Cold Email Benchmarks Into Qualified Pipeline
LeadCanal helps B2B companies build targeted cold email campaigns around deliverability, relevance, and measurable sales outcomes.
Request a cold email audit from LeadCanal to discover where your current campaign is losing replies and what should be improved first.